Highlight

Successful together – our valantic Team.
Meet the people who bring passion and accountability to driving success at valantic.
Get to know usvalantic Viewpoint
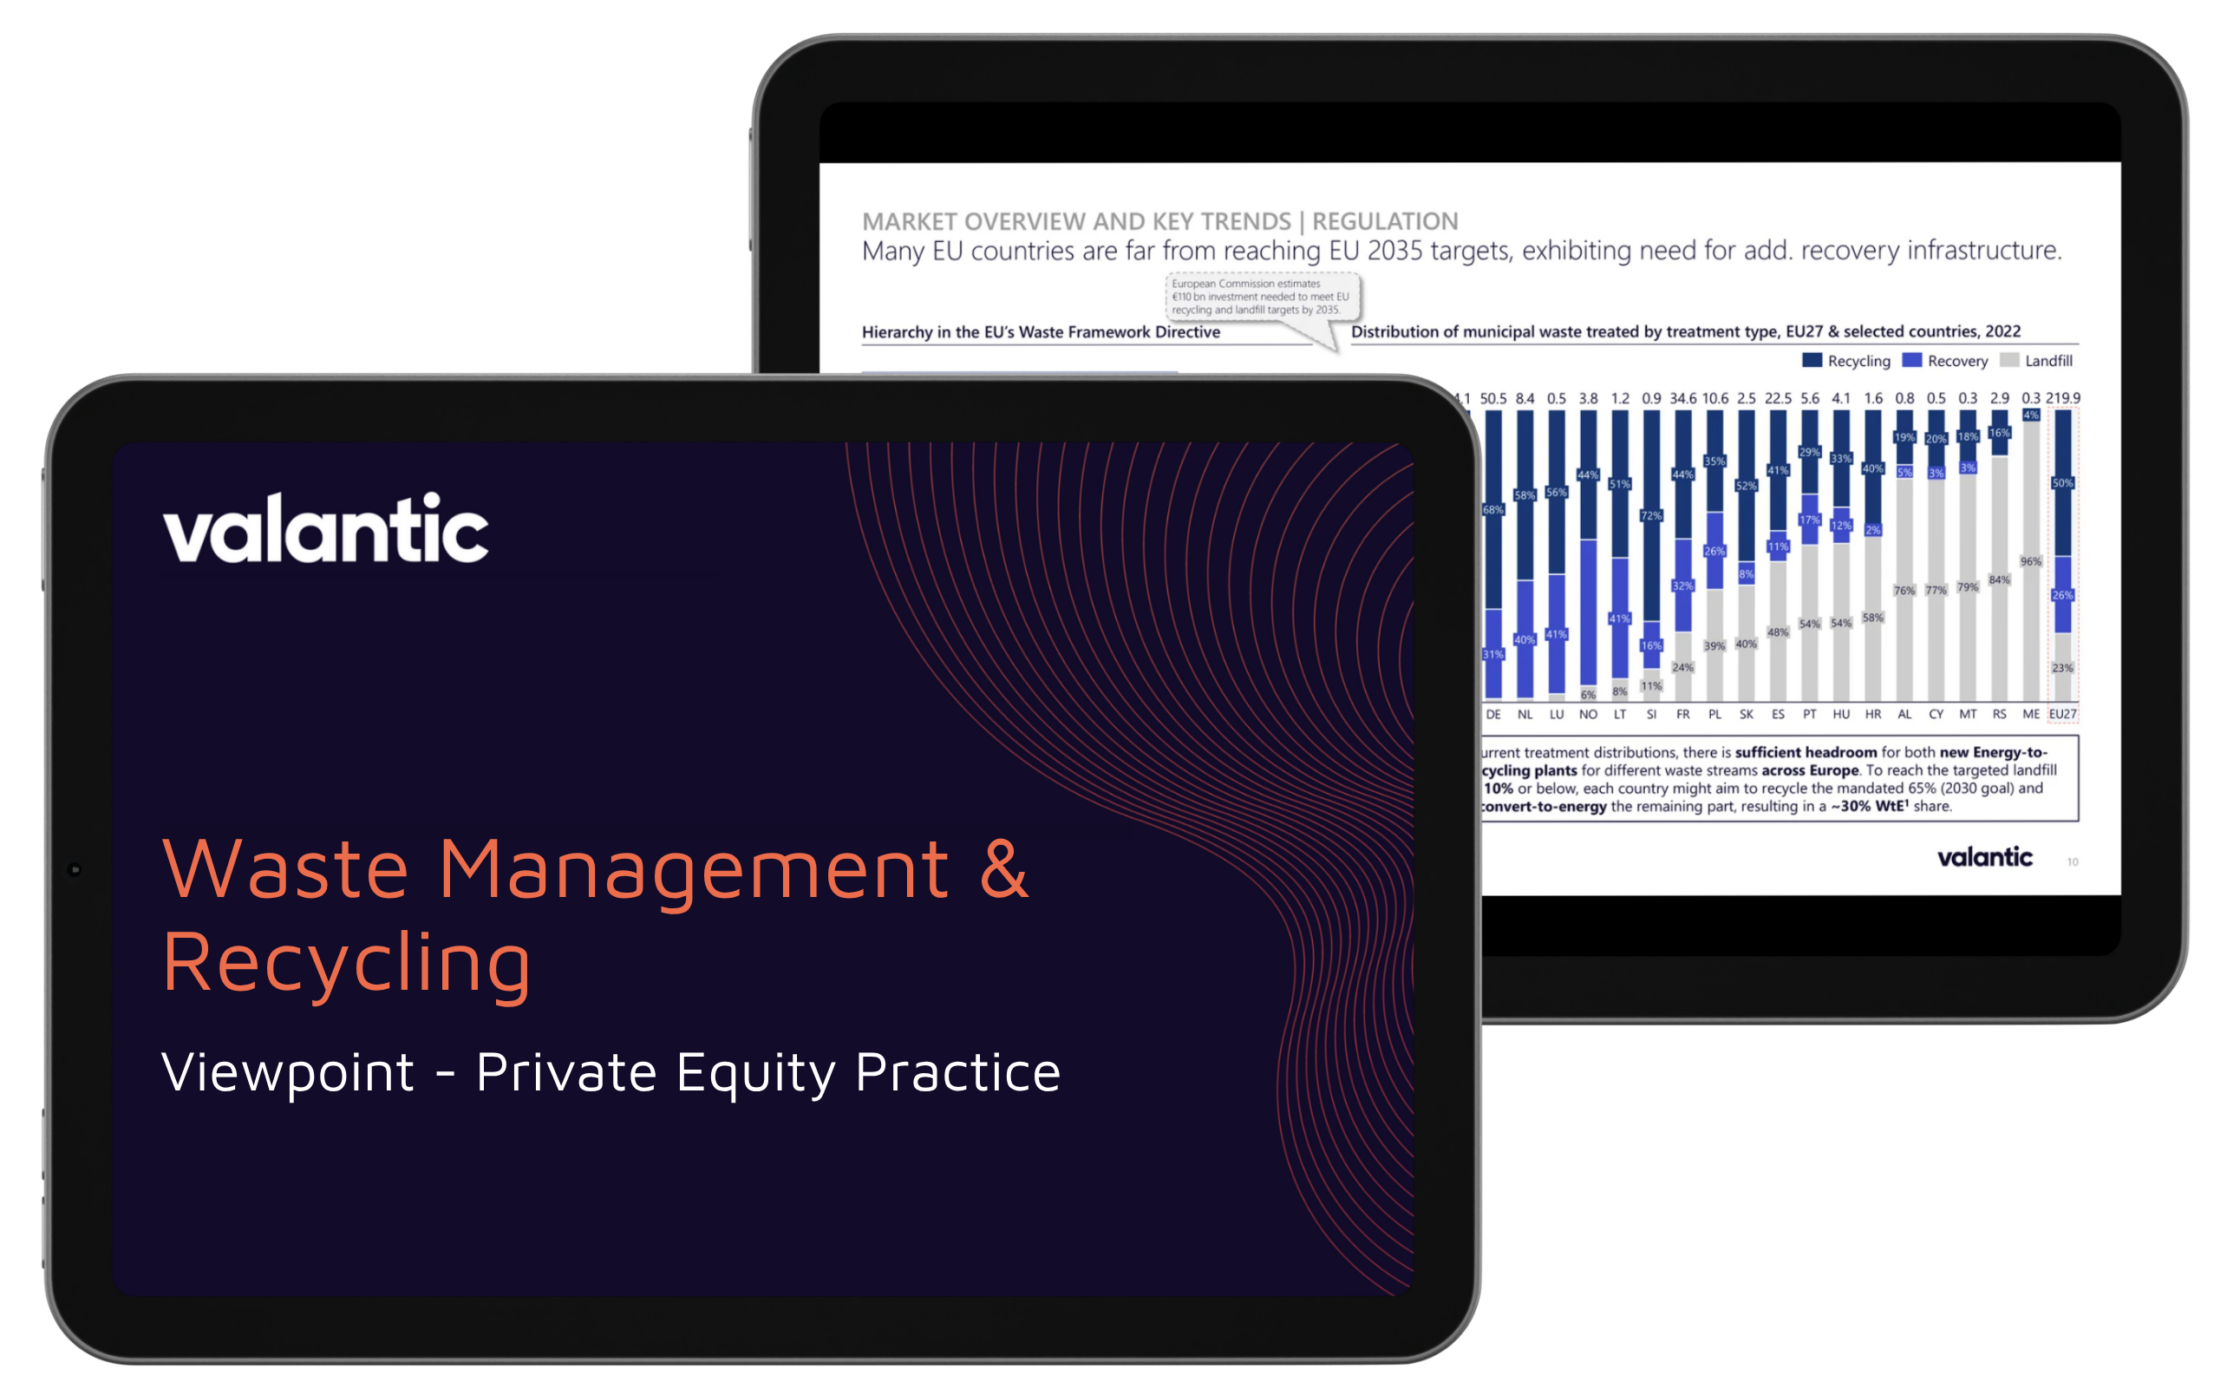
Europe’s waste management market is moving from disposal to recovery, creating a major opportunity for value creation. EU regulation demands a steep rise in recycling, and digital innovation across the value chain is what makes it achievable.
This is an excerpt of our viewpoint on Waste Management & Recycling. Get in touch if you would like to learn more about the market dynamics, regulatory drivers, value chain, competitive landscape and investment opportunities in this market.

~15% gap
between current EU recycling rate and the 2035 target
~40% increase
of EU waste recovery volumes since 2004
~110bnEUR
infrastructure investment needed to meet EU targets
Executive Summary
European waste management is a mature market with a new value logic. Total volumes have held at ≈2.2bn tonnes for over a decade, as waste generation has decoupled from GDP growth. Value is moving from disposal to recovery. Recycling and energy recovery grew by more than 40% since 2004, while landfill volumes fell by about a quarter. The main driver is regulation: binding EU targets of 65% recycling and at most 10% landfill by 2035.
Most member states are still far from these targets, which leaves a gap of ≈110bnEUR in infrastructure investment. Consumer awareness and technology add to the pressure, as AI-powered sorting, robotics and chemical recycling gain commercial traction. The competitive landscape is highly fragmented, with a few international leaders and thousands of local operators. This favours buy-and-build strategies. Vertical integration and digital enablement stand out as the strongest levers for investors.
Commercial and industrial waste earns twice, through intake fees and sales of recycled material.
Long-term contracts and regulatory entry barriers make waste management resilient through economic downturns.
Asset-light digital enablers combine recurring SaaS revenues with fragmentation that suits consolidation.

Jan Dingerkus
valantic Partner & Managing Director
”Across the EU, 23% of municipal waste still goes to landfill, and some countries in our benchmark landfill more than three quarters. The 2035 limit is 10%. Building the recycling and recovery capacity to close that gap is a strong investment case.“
At first glance, the European waste management market looks static. Volumes in the EU27 have stayed at ≈2.2bn tonnes since 2010, even as real GDP kept growing. The historical CAGR of about 1% up to 2018 has flattened, and volumes are expected to grow only modestly. The composition shows where the business sits: industrial and commercial sources generate about 53% of all waste, construction and demolition about 38%, and municipal waste only about 9%. Below the flat total, the shift is dramatic. Recovery, meaning recycling plus energy recovery, has grown by more than 40% since 2004, while disposal volumes have dropped by about 25%. Higher production efficiency, reuse and stricter landfill rules explain the change. For investors, this means growth in waste management will not come from more waste. It will come from treating the same waste better, sorting it more precisely and turning more of it into secondary raw materials or energy.
Key Takeaways:
Regulation is the most important force in waste management today. EU policy has moved from end-of-pipe disposal to systemic circularity, from the Waste Framework Directive through two Circular Economy Action Plans to the new Packaging and Packaging Waste Regulation. Member states must recycle 65% of municipal waste and limit landfill to 10% by 2035. Many are far from these goals: several Southern European countries still landfill more than 75% of their municipal waste (such as Cyprus with 77% and Malta with 79%) , and Eastern European countries still landfill more than half of their municipal waste (such as Croatia with 58% and Hungary with 54%). Consumer pressure adds to this. About 64% of consumers see sustainability as a key purchase criterion, and more than 80% of EU citizens support stricter recyclability rules. Technology makes these targets reachable. AI-enabled sorting reaches accuracy close to 99%, and AI-driven logistics can cut costs by about 13%. Rising prices for virgin raw materials and EU carbon taxes make recyclates more competitive. Tighter export rules keep more waste inside Europe, which increases domestic treatment volumes.
Key Takeaways:
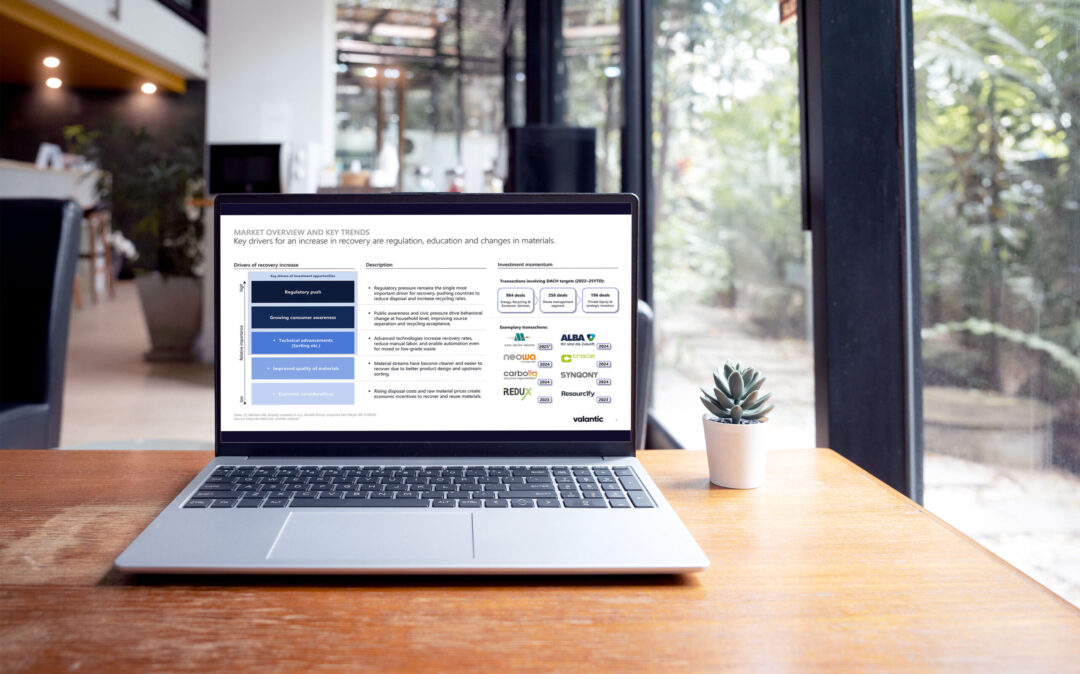
Europe’s waste management market is highly fragmented and regional. A small number of international leaders compete with thousands of subscale local operators. Deal activity is high: between 2022 and 2025, the DACH region saw 984 transactions in energy, recycling and environmental services. Of these, 258 were in waste management and 196 involved private equity or strategic investors. We see three groups of players. First, regional full-service operators in commercial and industrial waste, such as Lobbe, Knettenbrech + Gurdulic, Otto Dörner, Wurzer Umwelt, Brantner and Zentek. They combine collection, logistics and recycling, mostly within DACH. Second, specialised treatment players such as Thommen Furler and Envirowater Group, which focus on hazardous streams, chemicals or water treatment and benefit from high entry barriers. Third, digital enablers such as Waste Vision, cTrace, Sensoneo, Synqony, Wasteer, Schüttflix, Resourcify and Evreka. They provide software and hardware for route planning, sorting, tracking and material marketplaces. The groups differ mainly in asset intensity, waste type focus and how far along the value chain they reach.
Key Takeaways:
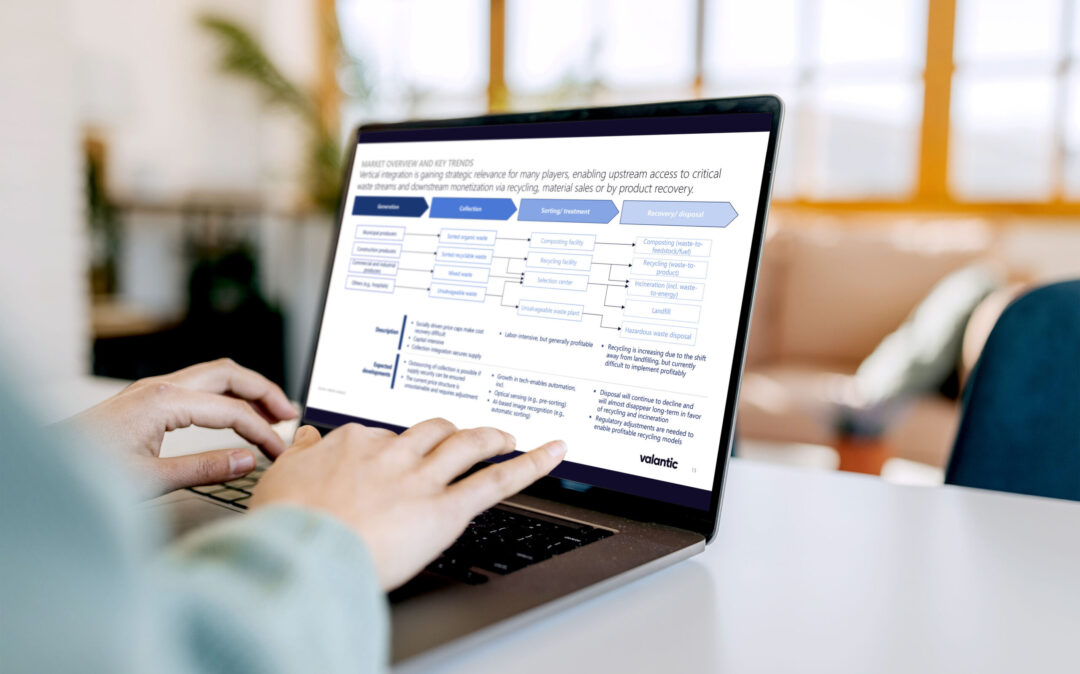
The waste management value chain has three stages: Collection, Sorting & Treatment, Recovery & Disposal. Each stage has its own economics. Collection is capital intensive and, in the municipal segment, often limited by socially driven price caps. It still matters strategically, because owning collection secures access to waste streams. Sorting and treatment are labour intensive but generally profitable, and automation through optical sensing and AI image recognition is raising margins. Recycling is growing as landfill declines, but profitable models often depend on regulation and commodity prices. The business models differ strongly by segment. Municipal waste is secure and infrastructure-like, but CAPEX and logistics heavy. Commercial and industrial non-hazardous waste is served through direct, long-term contracts and earns twice: once from the intake fee and once from sales of recycled materials. Across all segments, integrated players capture more value by controlling both upstream supply and downstream monetisation.
Key Takeaways:
Investment potential in waste management differs clearly by segment. Our analysis points to two areas. The first is commercial and industrial (C&I) non-hazardous waste. It benefits from rising circular economy relevance, stable long-term contracts, double monetisation and high processing volumes that increase margins. Consolidating regional operators creates scale in logistics and sorting, and adding recycling capacity opens new revenue from secondary raw materials. The second is digital enablement. Solution providers improve efficiency along the whole chain, from digital fleet dispatching and AI-based route optimisation to machine-learning sorting and automated carbon footprint reporting. These asset-light SaaS models offer recurring revenues, scalability and ownership of customer data. Because many enablers cover only one or two value chain steps, combining them into end-to-end platforms is a clear lever. More than 100mEUR is invested each year in EU-funded R&D projects in this field. Several risks need close attention, including volatile commodity prices, dependence on national tax policy, capital intensity and a growing shortage of skilled labour.
Key Takeaways:

Want the full breakdown? The full viewpoint on the Waste Management & Recycling Market is available on request. The typical scope includes market size, market trends & drivers, competitive landscape, competitor groups, competitor benchmarks, explanation of the business model.

Jan Dingerkus
Partner & Managing Director
Private Equity Practice

Khalid Ouaamar
Managing Director
Private Equity Practice
Christoph Nichau
Partner & Managing Director
Private Equity Practice