Transparent, optimized warehouse processes with SAP WI
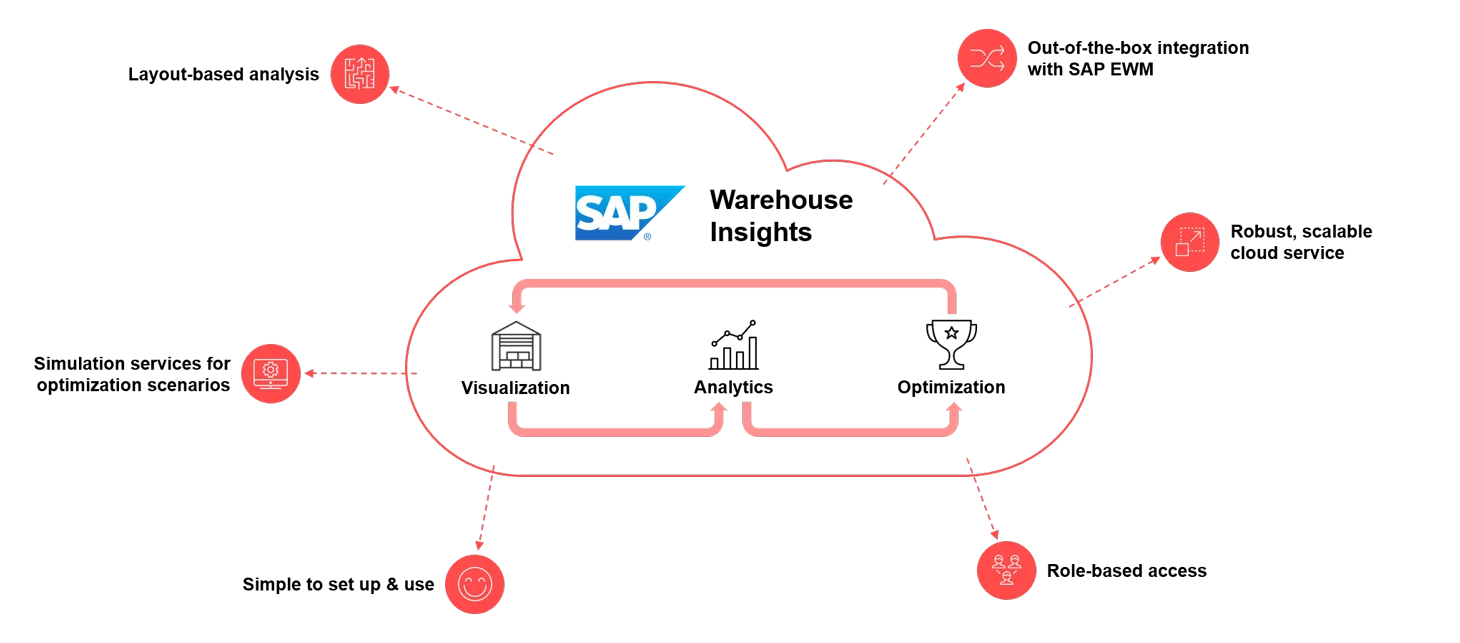
Warehouse Insights is a cloud-based SAP planning tool for the analysis, visualization, and optimization of warehouse operation in real time. Using algorithms, WI can depict the warehouse layout, calculate the relevant KPIs, simulate optimization scenarios, and monitor warehouse flows. This provides detailed insights into warehouse activities and exceptions become obvious immediately. This, in turn, provides the opportunity to intervene actively in the control of warehouse activities and therefore to optimize warehouse operation in real time. SAP WI is an add-on to SAP Extended Warehouse Management. Based on the easy integration and wide industry use, warehouse costs can be reduced and efficiency increased.
SAP WI is the add-on for SAP Extended Warehouse Management (EWM) for providing detailed insight into warehouse operations. With various visualization, analysis, and optimization functionalities, it contributes to a further efficiency increase in the warehouse.
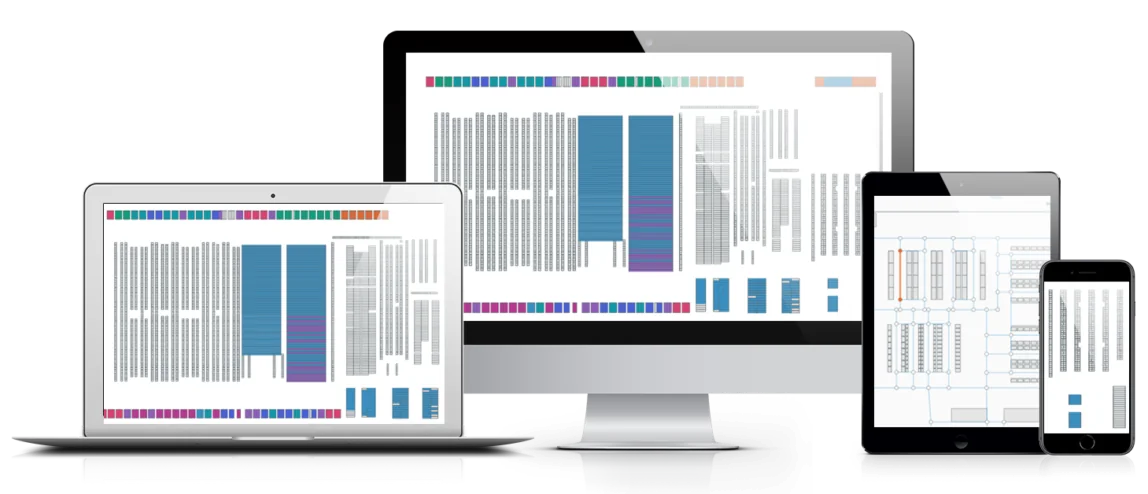
Visualization –
warehouse layout
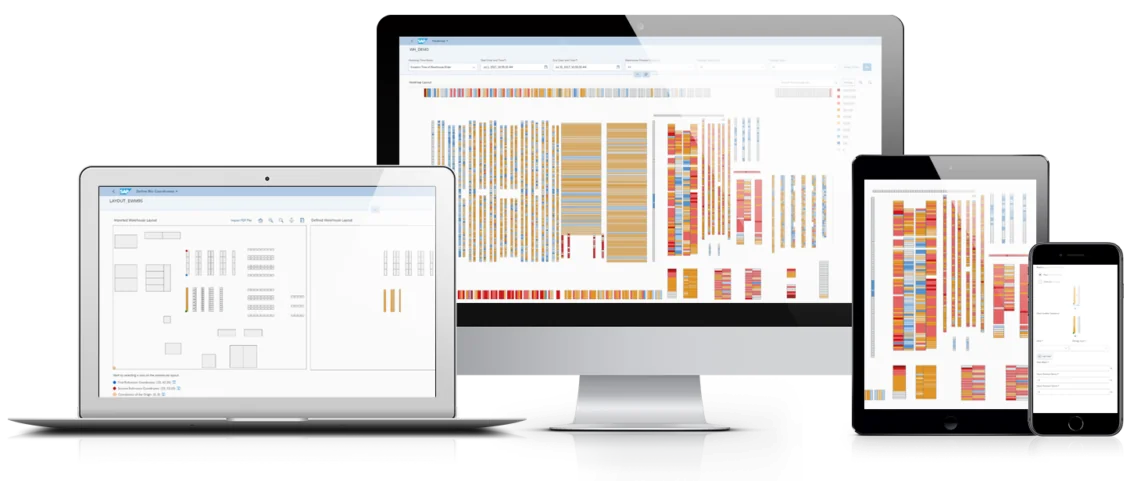
Use of the graphic, interactive warehouse layouts for various analytical activities. In addition to displaying and checking all warehouse storage details, the warehouse layout is used, especially for travel analyses.
The application of the route network checks to make sure everything is complete and can add to the network manually if desired. Nodes and borders can be created or adjusted as necessary. The travel route network provides the basis for all distance calculations in SAP WI.
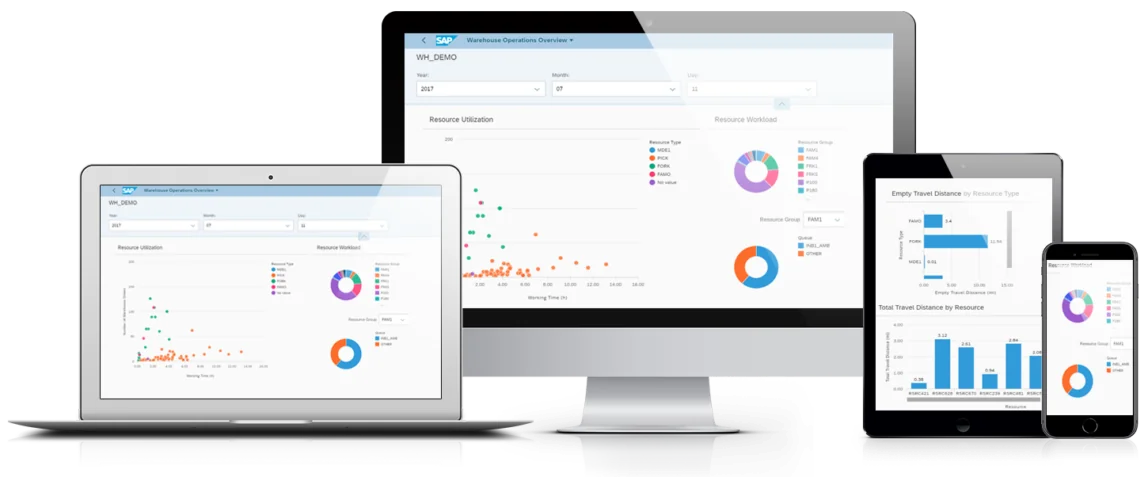
Overview –
warehouse activities
Using various analytical tools, it is possible to gain deeper insight into warehouse operation and its performance. Based on historic data, a multitude of KPIs such as resource utilization per resource group or empty runs per resource group can be calculated and displayed.
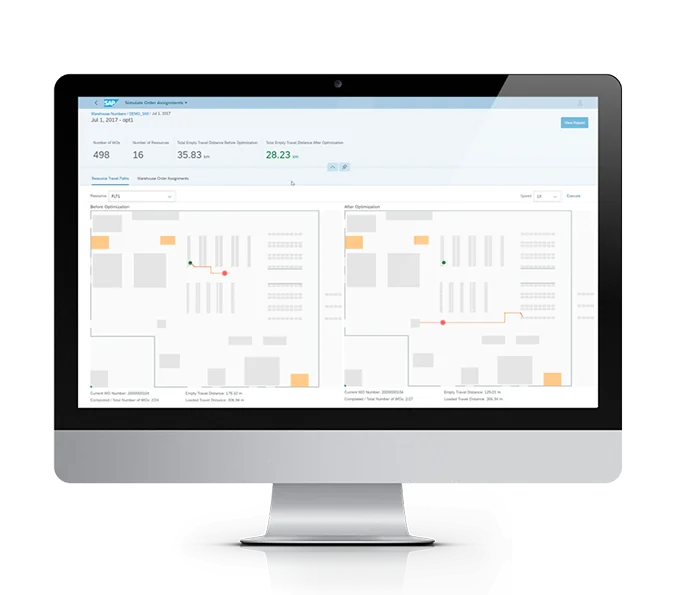
Simulation –
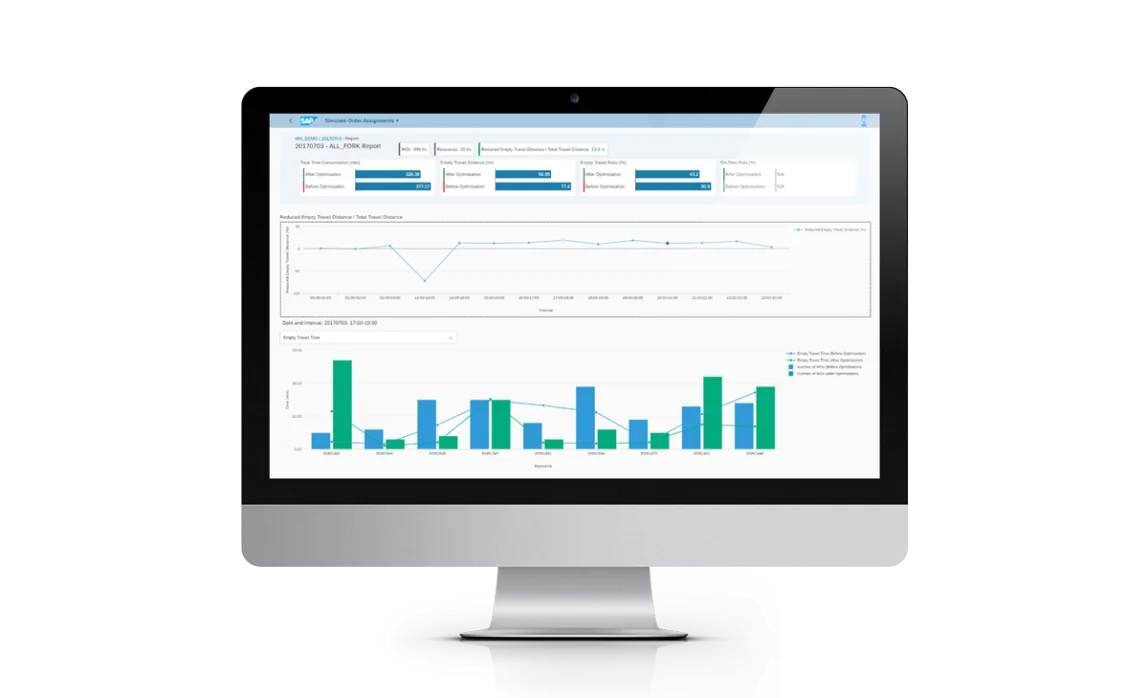
order assignment
Based on past transaction data, the user can simulate the assignment of resources and orders in order to reveal potential optimization possibilities. If optimization is scheduled during operation, for example, empty runs can be reduced.
Visualization – heat map
Using different color gradients, users get a complete overview of all relevant activities that take place in a warehouse. This way, bottlenecks and inefficiencies can be revealed and eliminated.
In SAP WI, warehouse layouts from CAD systems can be imported in PDF format and then processed further. Based on manually assigned warehouse location coordinates, the coordinates of the remaining areas are calculated automatically.