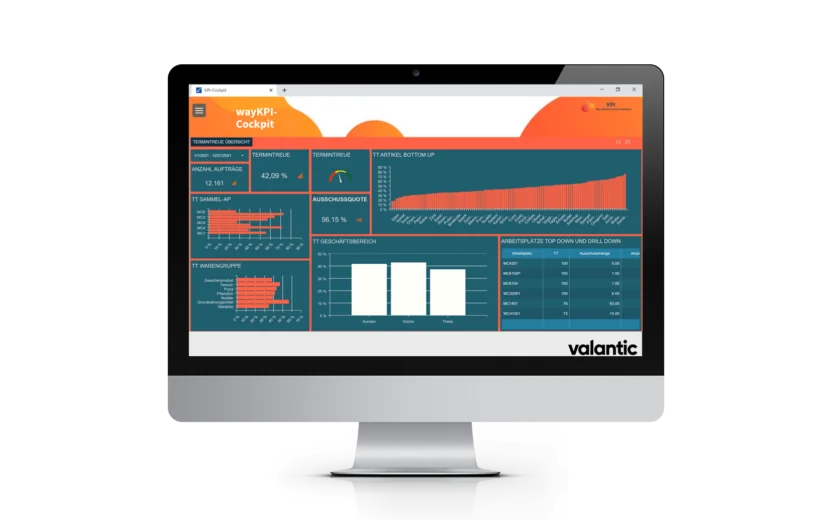
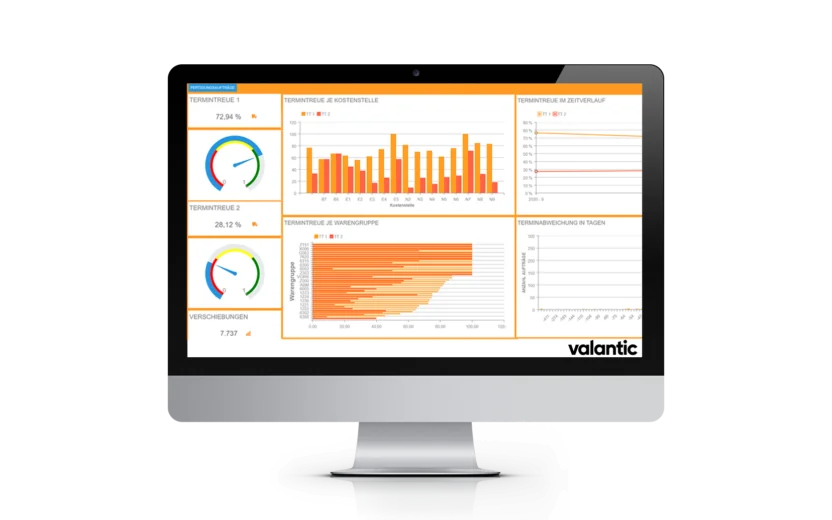
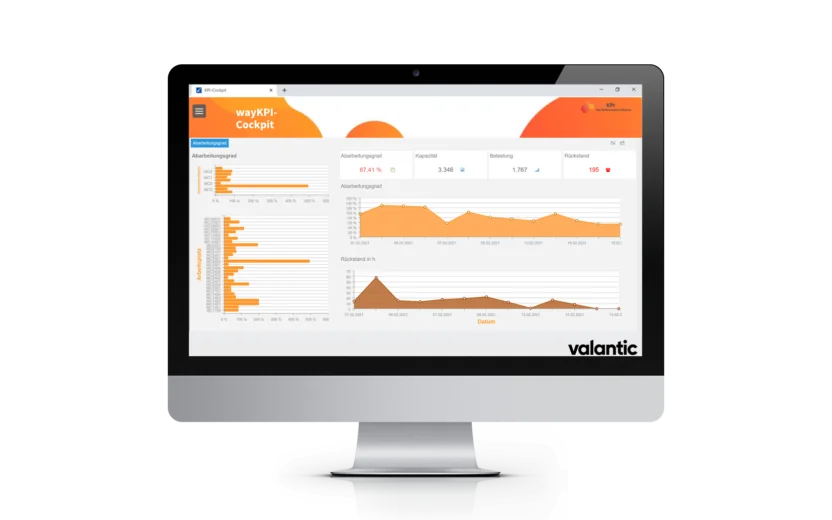
With wayKPI’s BI (business intelligence) tool, companies get an overview of their supply chain’s performance with company-specific KPIs. wayKPI creates, visualizes, analyzes, and presents KPIs. With KPI cockpits, users can get an overview of their KPIs and their development at any time on any end user device. They can use KPI dashboards to analyze their KPIs and data down to the individual document and from every point of view. Reports can be configured according to your desires and specifications. wayKPI’s report generator handles the regular updating and distribution of the reports.
The direct connection to wayRTS with pre-configured KPIs quickly ensures wide-ranging transparency with regard to the degree of implementation of the planning results in the relevant departments.
wayKPI is a comprehensive business intelligence toolbox in a single product. Web-based management dashboards and user-specific wayKPI cockpits enable custom-tailored preparation of information. Flexibly designed reports and graphics support consumer-appropriate information distribution, which can be handled intuitively thanks to MS Office integration. The possible incorporation of target functions and weighting for KPI compression allows the design of company-individual scorecards.


